The majority of the libraries developers use in their projects these days are open source. So in case something crashes inside third party library or you just want to know how it works, it is possible to get the PDB files from Microsoft Symbols Servers and debug it. If for some reasons PDB cannot be found on the servers, you can always grab the source code from GitHub and add to your project manually. Unfortunately when you use commercial libraries, it is impossible to do any of the previous steps. Luckily with Resharper you are able to generate PDB files from assembly and use it later in Visual Studio to debug it.
Let’s assume we would like to generate PDB files for EntityFramework. First of all, we have to locate EntityFramework assembly in Assembly Explorer. Go to Solution Explorer, RMB click on assembly you are interested in and select View in Assembly Explorer.

In Assembly Explorer once again RMB click on EntityFramework and select “Generate Pdb…”

In the opened window, select the destination folder for the files.

Once you click “Generate“, Resharper will process the assembly and generate PDBs.

Once the files are generated we have to tell Visual Studio to use them. In order to do that, run the app and stop the execution with some breakpoint, then go to Debug->Windows-> Modules, locate EntityFramework.dll, click it with RMB, select “Load Symbols” and choose file(s) generated by Resharper.

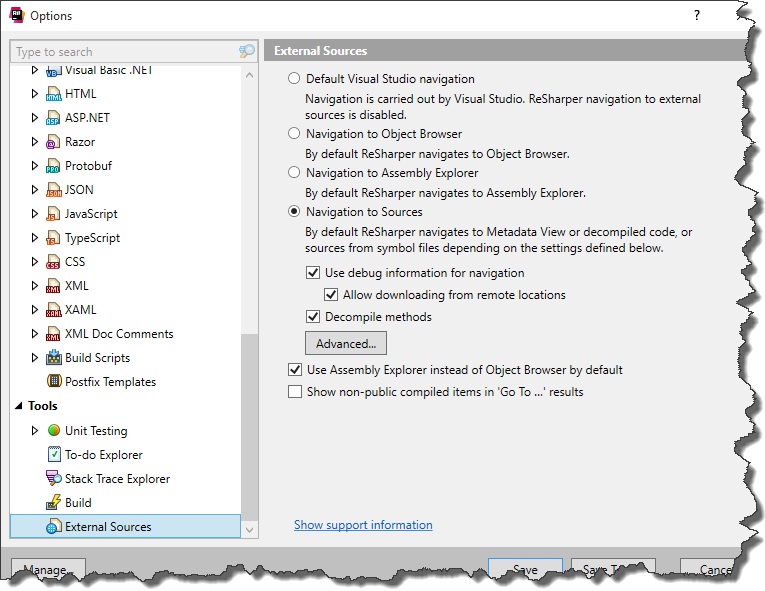
A this point we have PDB files ready but we are not able to set any breakpoint as we don’t have source code of EntityFramework. Fortunately Resharper once again saves the day as it is able to navigate to decompiled sources. Just make sure that your settings (Resharper->Options->External Sources) are the same as in the picture below

and you can navigate to external libraries’ source code just like they were in your project. The very last step is to disable “Enable Just My Code” option in Tools->Options->Debugging->General

and from now on you can debug the external library
