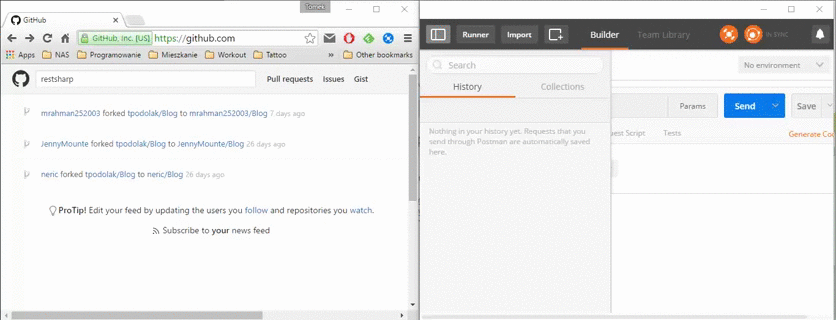
If you are doing any kind of rest api development you probably have heard of Postman. Long story short, it is a Chrome extension which allows you to send http requests in a very easy and intuitive way. Apart from that (and many other features), it also allows you to intercept browser request. As this feature is very easy to overlook, here is a simple guide how to use it.
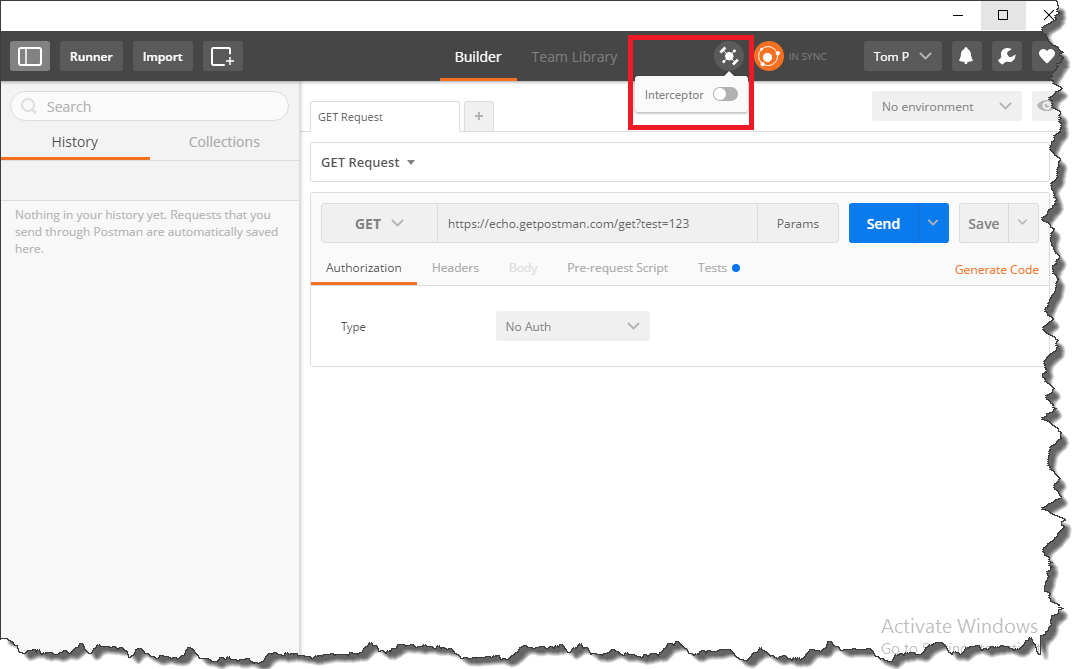
In the Postman window, click little satellite look-like button and toggle the “Interceptor” switch
Postman will ask you to install additional plugin called Postman Interceptor
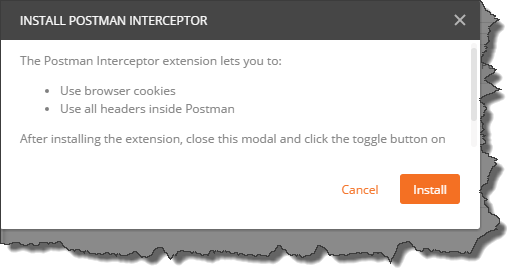
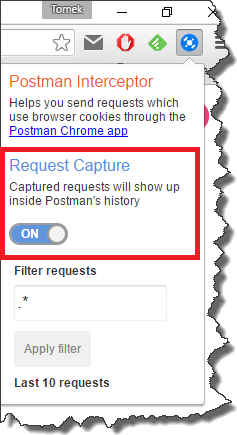
Once you click “Install” you will be redirected to Chrome Web Store where you can add the plugin to the browser. After successful installation you will see additional icon in Chrome menu bar. Click it and toggle “Request capture” switch
When you go back to Postman and toggle again “Interceptor” button, it will be synchronized with Postman Interceptor plugin
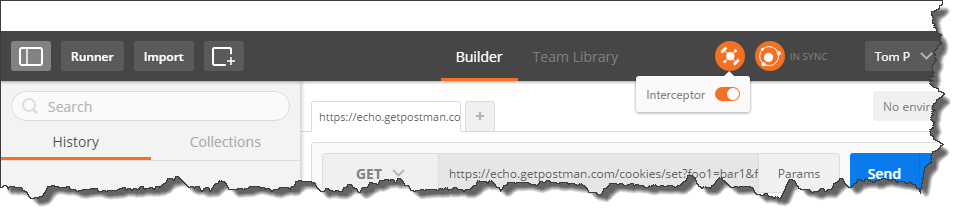
and from now on, requests sent by browser will be visible in requests history
where you will be able to modify and resend them.
Month: July 2016
Generating PDB files with Resharper
The majority of the libraries developers use in their projects these days are open source. So in case something crashes inside third party library or you just want to know how it works, it is possible to get the PDB files from Microsoft Symbols Servers and debug it. If for some reasons PDB cannot be found on the servers, you can always grab the source code from GitHub and add to your project manually. Unfortunately when you use commercial libraries, it is impossible to do any of the previous steps. Luckily with Resharper you are able to generate PDB files from assembly and use it later in Visual Studio to debug it.
Let’s assume we would like to generate PDB files for EntityFramework. First of all, we have to locate EntityFramework assembly in Assembly Explorer. Go to Solution Explorer, RMB click on assembly you are interested in and select View in Assembly Explorer.

In Assembly Explorer once again RMB click on EntityFramework and select “Generate Pdb…”

In the opened window, select the destination folder for the files.

Once you click “Generate“, Resharper will process the assembly and generate PDBs.

Once the files are generated we have to tell Visual Studio to use them. In order to do that, run the app and stop the execution with some breakpoint, then go to Debug->Windows-> Modules, locate EntityFramework.dll, click it with RMB, select “Load Symbols” and choose file(s) generated by Resharper.

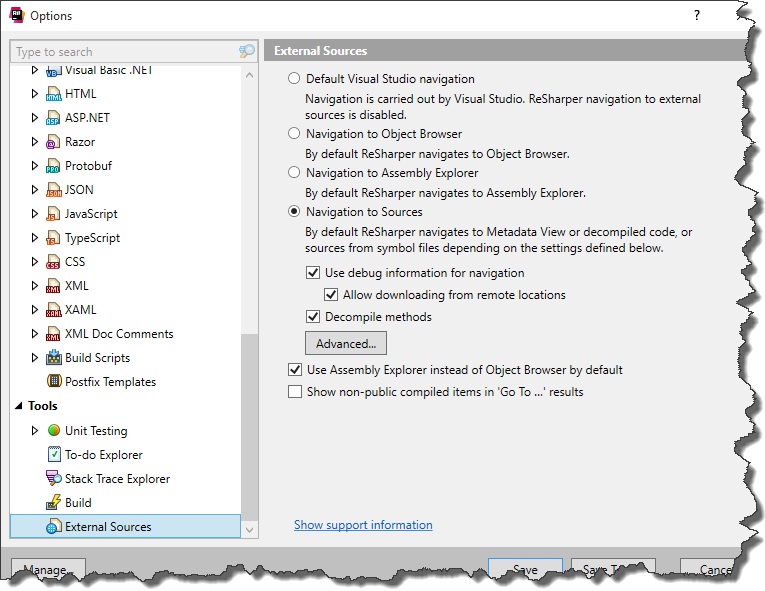
A this point we have PDB files ready but we are not able to set any breakpoint as we don’t have source code of EntityFramework. Fortunately Resharper once again saves the day as it is able to navigate to decompiled sources. Just make sure that your settings (Resharper->Options->External Sources) are the same as in the picture below
and you can navigate to external libraries’ source code just like they were in your project. The very last step is to disable “Enable Just My Code” option in Tools->Options->Debugging->General

and from now on you can debug the external library

Debugging cake scripts
We’ve been using Cake in our project for quite some time and it has been working great. However for time to time lack of debugging support was really annoying for me. Fortunately it seems that these times are gone now. During NDC Oslo 2016 Gary Ewan Park showed that it is possible to attach debugger to the build process. Here are the steps to achieve that. Let’s assume that we have following simple cake script.
|
1 2 3 4 5 6 7 8 |
var target = Argument("target", "Default"); Task("Default") .Does(() => { MSBuild(Directory("../") + File("DebuggingCakeScript.sln")); }); RunTarget(target); |
In order to make the debugging possible it is necessary to add
|
1 |
#break |
preprocessor directive to the task we want the debugger to stop.
|
1 2 3 4 5 6 7 8 9 |
var target = Argument("target", "Default"); Task("Default") .Does(() => { #break MSBuild(Directory("../") + File("DebuggingCakeScript.sln")); }); RunTarget(target); |
This operation doesn’t affect the default build process, so if you run in console
|
1 |
.\build.ps1 -target Default |
the build will run as usual. In order to be able to attach the debugger we have to call Cake with
|
1 |
--debug |
flag. You can’t do it directly via
|
1 |
\build.ps1 |
script so assuming that you didn’t change directory structure created by bootstrapper, go to Tools/Cake folder and run from PowerShell
|
1 |
.\Cake.exe ..\..\build.cake -target=Default --debug |
where
|
1 |
..\..\build.cake |
is path to your cake script and
|
1 |
Default |
is task you want to start. Once you run the command, cake will wait for attaching the debugger

Now launch Visual Studio, go to Debug-> Attach to Process…, find process id listed in console

and click Attach. After couple of seconds Visual Studio will load your cake script and you will be able to debug it like normal application.

NLog – tracking flow of requests using MappedDiagnosticsLogicalContext
1. Problem
Everyone who has ever had to analyze logs from production environment knows, that quite often it is not an easy task. Usually application flow is deduced by log entries matched by thread id, which is problematic when you deal with multithreading scenarios. Say for example we have following piece of code
|
1 2 3 4 5 6 7 8 9 10 11 12 13 14 15 16 17 18 19 20 21 22 23 24 |
public class HomeController : Controller { private static readonly Logger Logger = LogManager.GetCurrentClassLogger(); public async Task<ActionResult> Index() { await PreprocessRequest(nameof(Index)); return View(); } private static async Task PreprocessRequest(string actionName) { Logger.Info($"Log from {actionName} action, from thread={Thread.CurrentThread.ManagedThreadId}"); await Task.Run(() => Logger.Info($"Log from {actionName}, from thread {Thread.CurrentThread.ManagedThreadId} assigned by scheduler")) .ConfigureAwait(continueOnCapturedContext: false); Logger.Info($"Log from {actionName} action, from async continuation, from thread {Thread.CurrentThread.ManagedThreadId}"); var thread = new Thread(() => Logger.Info($"Log from {actionName} action, from explicitly created thread {Thread.CurrentThread.ManagedThreadId}")); thread.Start(); thread.Join(); } } |
Default log file usually looks like that
|
1 2 3 4 5 6 |
TimeStamp=2016-07-03 11:56:02.2327 ThreadId=5 Level=INFO Message=About to start GET / request TimeStamp=2016-07-03 11:56:02.3797 ThreadId=5 Level=INFO Message=Log from Index action, from thread=5 TimeStamp=2016-07-03 11:56:02.3797 ThreadId=6 Level=INFO Message=Log from Index, from thread 6 assigned by scheduler TimeStamp=2016-07-03 11:56:02.3797 ThreadId=6 Level=INFO Message=Log from Index action, from async continuation, from thread 6 TimeStamp=2016-07-03 11:56:02.3917 ThreadId=14 Level=INFO Message=Log from Index action, from explicitly created thread 14 TimeStamp=2016-07-03 11:56:04.8250 ThreadId=8 Level=INFO Message=Request completed with status code: 200 |
Having multiple simultaneous Index requests, makes it almost impossible to figure out which log entry is part of which call. Fortunately with NLog it is possible to solve this problem without too much of a hassle.
2. Proposed solution
The whole idea is to leverage MappedDiagnosticsLogicalContext “storage” to keep some unique identifier of request for entire call. Note, that this identifier will be accessible also from other threads created from within given call. In order to set unique request id (also known as correlation id) I will use custom HttpModule. The very first implementation looks like that
|
1 2 3 4 5 6 7 8 9 10 11 12 13 14 15 16 17 18 19 20 21 22 23 24 25 26 27 28 29 30 31 32 |
public class LoggingHttpModule : IHttpModule { private const string CorrelationIdKey = "correlationid"; private static readonly Logger Logger = LogManager.GetCurrentClassLogger(); public void Init(HttpApplication context) { context.BeginRequest += HandleBeginRequest; context.EndRequest += HandleEndRequest; } public void Dispose() { } private void HandleBeginRequest(object sender, EventArgs e) { var value = Guid.NewGuid().ToString(); var httpApplication = (HttpApplication) sender; var httpContext = httpApplication.Context; MappedDiagnosticsLogicalContext.Set(CorrelationIdKey, value); Logger.Info($"About to start {httpContext.Request.HttpMethod} {httpContext.Request.RawUrl} request"); } private void HandleEndRequest(object sender, EventArgs e) { var httpApplication = (HttpApplication) sender; var httpContext = httpApplication.Context; Logger.Info($"Request completed with status code: {httpContext.Response.StatusCode} "); } } |
Once the HttpModule is ready it is necessary to register it in web.config.
|
1 2 3 4 5 6 7 8 9 10 11 12 13 14 15 |
<!--rest of the code omitted --> <system.webServer> <modules> <!--rest of the code omitted --> <add name="LoggingHttpModule" type="AspNetMvcLoggingWithCorrelationId.HttpModules.LoggingHttpModule"/> </modules> </system.webServer> <!--rest of the code omitted --> <system.web> <!--rest of the code omitted --> <httpModules> <!--rest of the code omitted --> <add name="ApplicationInsightsWebTracking" type="Microsoft.ApplicationInsights.Web.ApplicationInsightsHttpModule,Microsoft.AI.Web"/> </httpModules> </system.web> |
From now on, every request goes through LogginHttpModule and proper correlationId is set in MappedDiagnosticsLogicalContext.
As we want to have correlationId included in log files it is necessary to modify Nlog.config. In my case it looks like that
|
1 2 3 4 5 6 7 8 9 10 11 12 13 14 15 16 17 18 |
<?xml version="1.0" encoding="utf-8" ?> <nlog xmlns="http://www.nlog-project.org/schemas/NLog.xsd" xmlns:xsi="http://www.w3.org/2001/XMLSchema-instance" xsi:schemaLocation="http://www.nlog-project.org/schemas/NLog.xsd NLog.xsd" autoReload="true" throwExceptions="false" internalLogLevel="Off" internalLogFile="c:\temp\nlog-internal.log" > <variable name="myvar" value="myvalue"/> <targets> <target xsi:type="File" name="f" fileName="${basedir}/logs/${shortdate}.log" layout="TimeStamp=${longdate} CorrelationId=${mdlc:item=correlationid} Level=${uppercase:${level}} Message=${message}" /> </targets> <rules> <logger name="*" minlevel="Debug" writeTo="f" /> </rules> </nlog> |
Note that we can access our correlationId variable via ${mdlc:item=correlationid}
Log file after the changes looks like that
|
1 2 3 4 5 6 |
TimeStamp=2016-07-03 12:41:35.7292 CorrelationId=b322d1fa-47b2-4582-b7a9-c9463b7c0a47 Level=INFO Message=About to start GET / request TimeStamp=2016-07-03 12:41:35.8752 CorrelationId=b322d1fa-47b2-4582-b7a9-c9463b7c0a47 Level=INFO Message=Log from Index action, from thread=6 TimeStamp=2016-07-03 12:41:35.8752 CorrelationId=b322d1fa-47b2-4582-b7a9-c9463b7c0a47 Level=INFO Message=Log from Index, from thread 7 assigned by scheduler TimeStamp=2016-07-03 12:41:35.8752 CorrelationId=b322d1fa-47b2-4582-b7a9-c9463b7c0a47 Level=INFO Message=Log from Index action, from async continuation, from thread 7 TimeStamp=2016-07-03 12:41:35.8752 CorrelationId=b322d1fa-47b2-4582-b7a9-c9463b7c0a47 Level=INFO Message=Log from Index action, from explicitly created thread 9 TimeStamp=2016-07-03 12:41:38.4454 CorrelationId= Level=INFO Message=Request completed with status code: 200 |
This is almost perfect, however for some reasons correlationId is lost in EndRequest event handler. I am not sure if this is bug in NLog (I’ve posted question in Nlog’s github) or it is by design, however there is easy workaround for that. We can store our correlationId in HttpContext.Items collection and reassign it to MappedDiagnosticsLogicalContext in EndRequest event handler.
|
1 2 3 4 5 6 7 8 9 10 11 12 13 14 15 16 17 18 19 20 21 |
private void HandleBeginRequest(object sender, EventArgs e) { var value = Guid.NewGuid().ToString(); var httpApplication = (HttpApplication) sender; var httpContext = httpApplication.Context; MappedDiagnosticsLogicalContext.Set(CorrelationIdKey, value); httpContext.Items[CorrelationIdKey] = value; Logger.Info($"About to start {httpContext.Request.HttpMethod} {httpContext.Request.RawUrl} request"); } private void HandleEndRequest(object sender, EventArgs e) { var httpApplication = (HttpApplication) sender; var httpContext = httpApplication.Context; var correlationId = httpContext.Items[CorrelationIdKey].ToString(); MappedDiagnosticsLogicalContext.Set(CorrelationIdKey, correlationId); Logger.Info($"Request completed with status code: {httpContext.Response.StatusCode} "); } |
After these changes our log file finally looks OK
|
1 2 3 4 5 6 |
TimeStamp=2016-07-03 12:41:35.7292 CorrelationId=b322d1fa-47b2-4582-b7a9-c9463b7c0a47 Level=INFO Message=About to start GET / request TimeStamp=2016-07-03 12:41:35.8752 CorrelationId=b322d1fa-47b2-4582-b7a9-c9463b7c0a47 Level=INFO Message=Log from Index action, from thread=6 TimeStamp=2016-07-03 12:41:35.8752 CorrelationId=b322d1fa-47b2-4582-b7a9-c9463b7c0a47 Level=INFO Message=Log from Index, from thread 7 assigned by scheduler TimeStamp=2016-07-03 12:41:35.8752 CorrelationId=b322d1fa-47b2-4582-b7a9-c9463b7c0a47 Level=INFO Message=Log from Index action, from async continuation, from thread 7 TimeStamp=2016-07-03 12:41:35.8752 CorrelationId=b322d1fa-47b2-4582-b7a9-c9463b7c0a47 Level=INFO Message=Log from Index action, from explicitly created thread 9 TimeStamp=2016-07-03 12:41:38.4454 CorrelationId=b322d1fa-47b2-4582-b7a9-c9463b7c0a47 Level=INFO Message=Request completed with status code: 200 |
Source code for this post can be found here