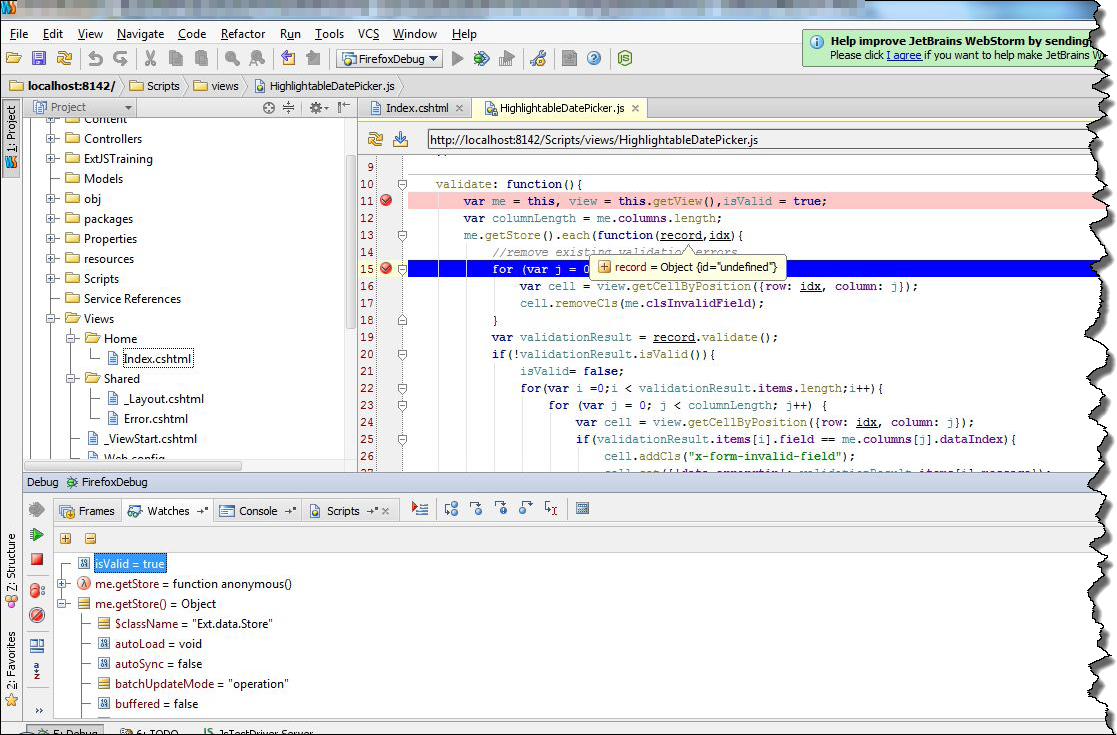
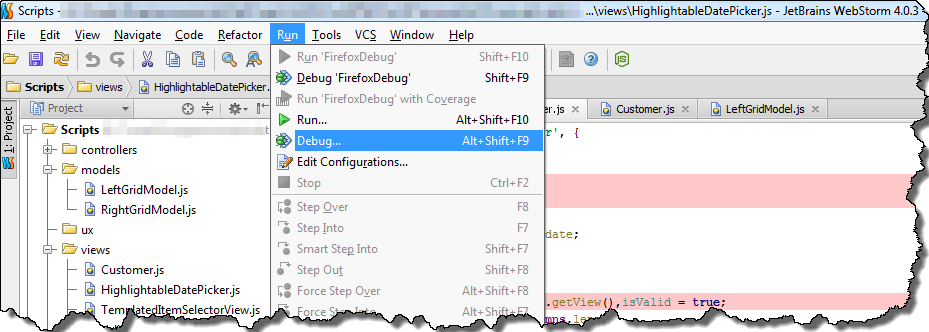
I’ve been working with ASP .NET combined with Extjs for about half a year. All this time for debugging I’ve been using Firebug in Firefox, or Developer Tools in Chrome. Although both of these tools are great, I decided to try to use build in WebStorm debugger. According to documentation this debugger should work with Firefox as well as with Chrome. However I’ve only managed to run it correctly with Firefox. In order to start debugging session, we have to make some preparation. Let’s choose option Debug… from Run menu
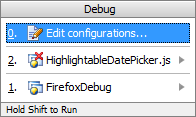
In opened small window, we have to choose first option – Edit configurations…
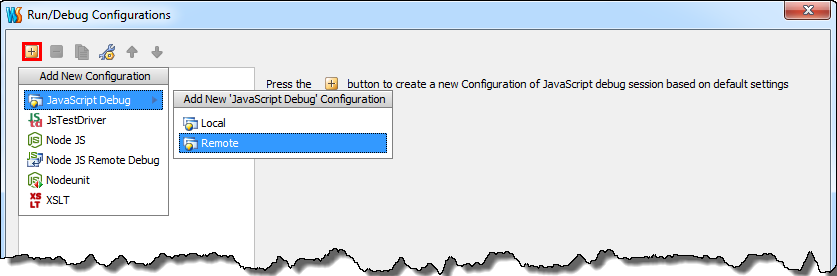
In the next window we can create new debugging profile. In order to do that, click on + sign in the left upper corner of window, then choose JavascriptDebug and Remote option.
This is the final step of the configuration. The most important fields in configuration window is URL to open field, in which we specify adress of our site. In my case it is localhost on port 8142. We also have to specify mapping from remote host direcotry structure to our directory structure. Sample configuration is presented below
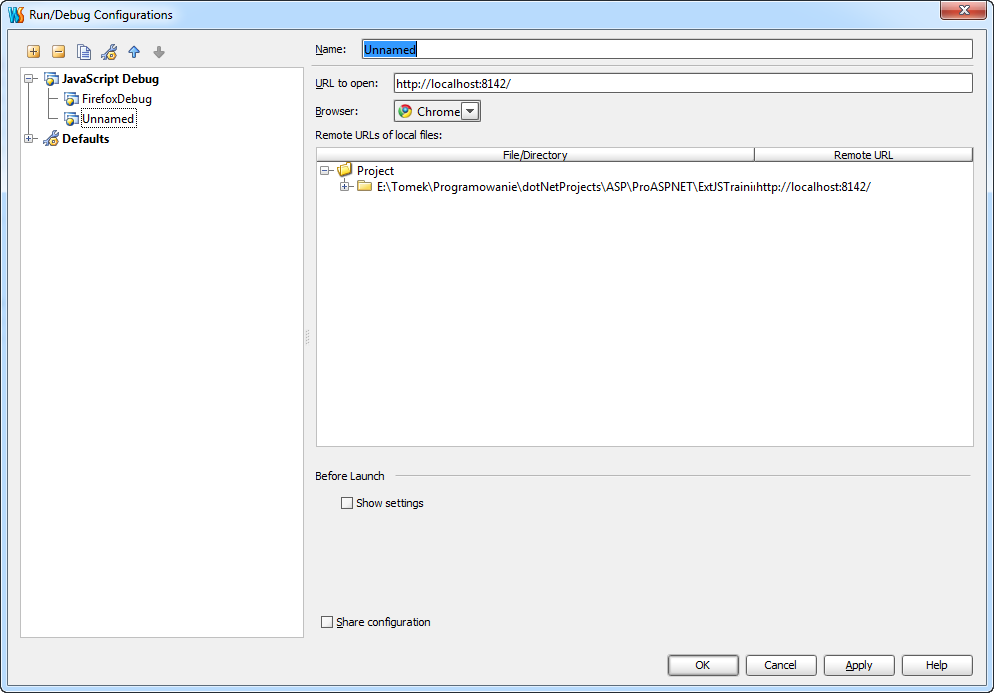
We also have a possibility to choose browser in which our site will be displayed. I decided to choose Firefox because of the fact, that WebStorm debugger had some problems with Chrome. Now we can try to run debugging session by pressing ALT+F9. If we choose Firefox, in the very first time we run debugger, we will see this window
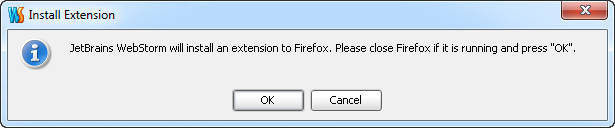
which informs us that WebStorm must install extension to Firefox. Clicking OK button starts Firefox
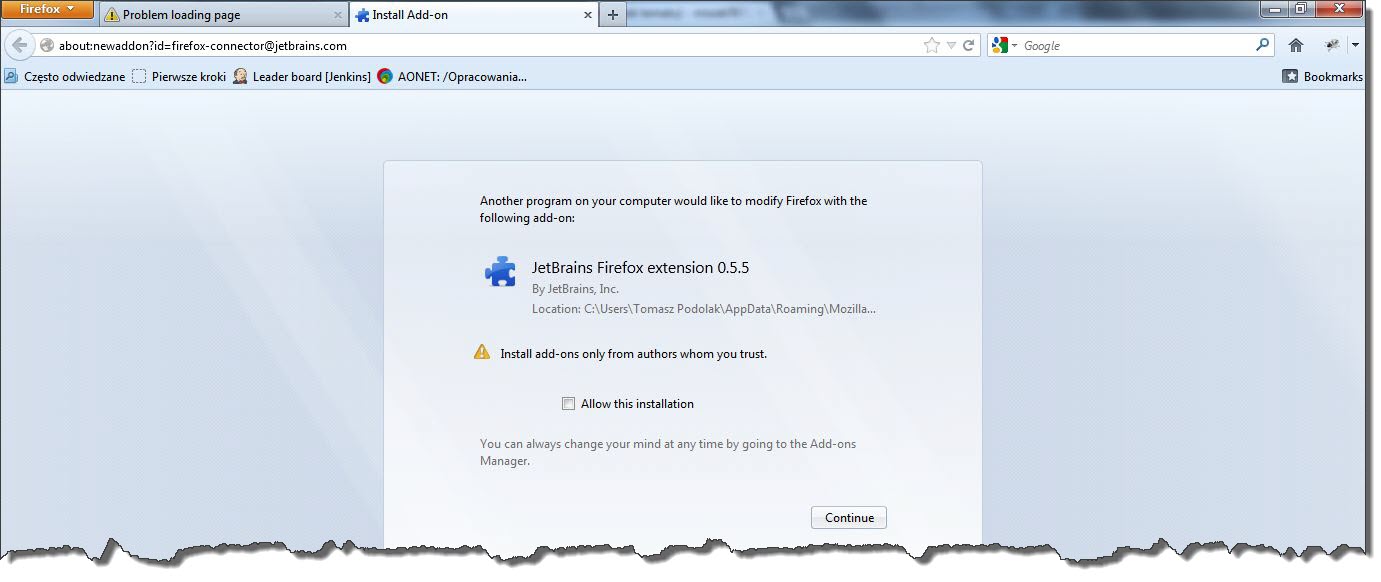
which warns us that external program is trying to install extension. Clicking continue button will finish configuration process, and WebStorm will successfully attach debugger.