Fixing missing semicolon issue using WebStorm

Recently in the company I work for, we’ve been trying to improve Javascript code quality. After hooking up JSlint into our build script, it turned out that the most common issue with our code is missing semicolon at the end of statements. Fixing all warnings manually would be very boring task, that is why I started searching for alternative solution. Fortunatelly once again, WebStorm came for the rescue. As you probably know WebStorm has it’s own code inspection tool which indicates problems with code. However except that, this tool can also fix these problems automatically. Here is a little demonstration. Let us start with simple code.

In the listing above, there are two lines with missing semicolon (in function getView). Let fix them using Webstorm code inspection tool.
First of all, we have to make sure that appropriate inspection options are selected. In order to do that, let’s choose “Settings” from menu “File”. In the opened window, go to “Settings” and select options presented in the picture below.
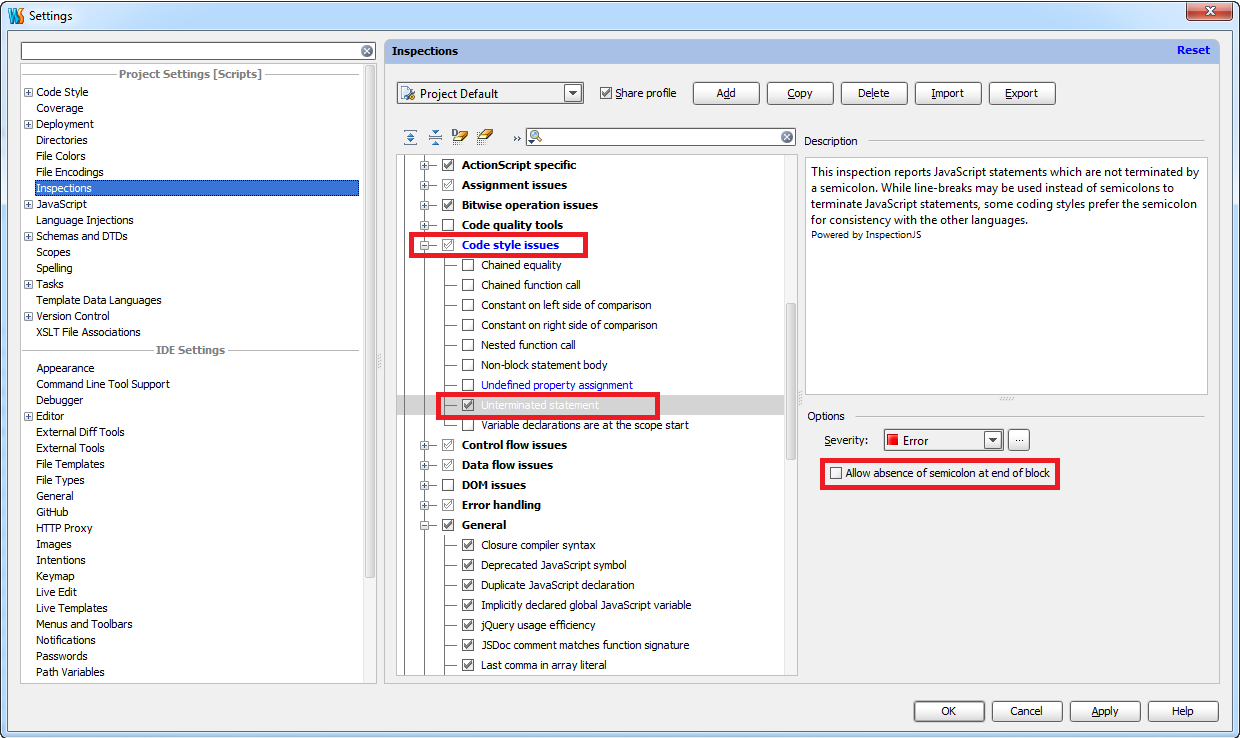
options
In the next step, from menu “Code” choose “Inspect code”
InspectCode
In the opened window, we can change inspection profile or inspection scope, but usually we can go with default settings
InspectCodeWindow
After inspection is done, at the bottom of the screen you will see results
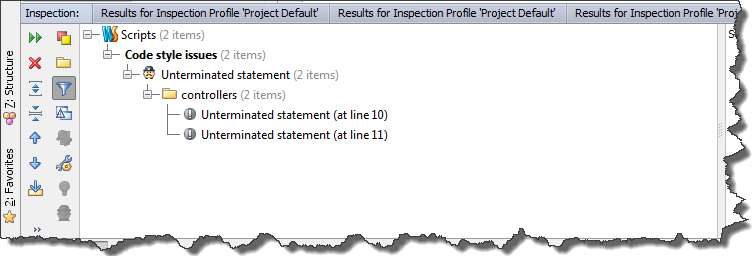
InspectionResult
Now, we can quickly fix them by using context menu and clicking “Terminate statement”
InspectionResultMenu
Here is the result of fixing operation
missing semicolon

Fixing missing semicolon issue using WebStorm

ASP.NET MVC javascript debugging using WebStorm

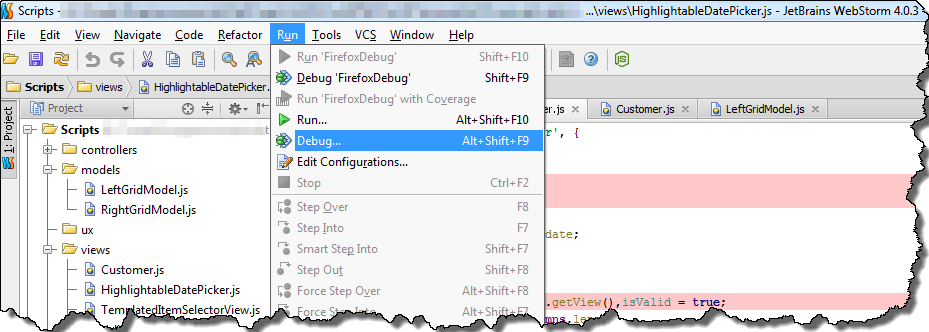
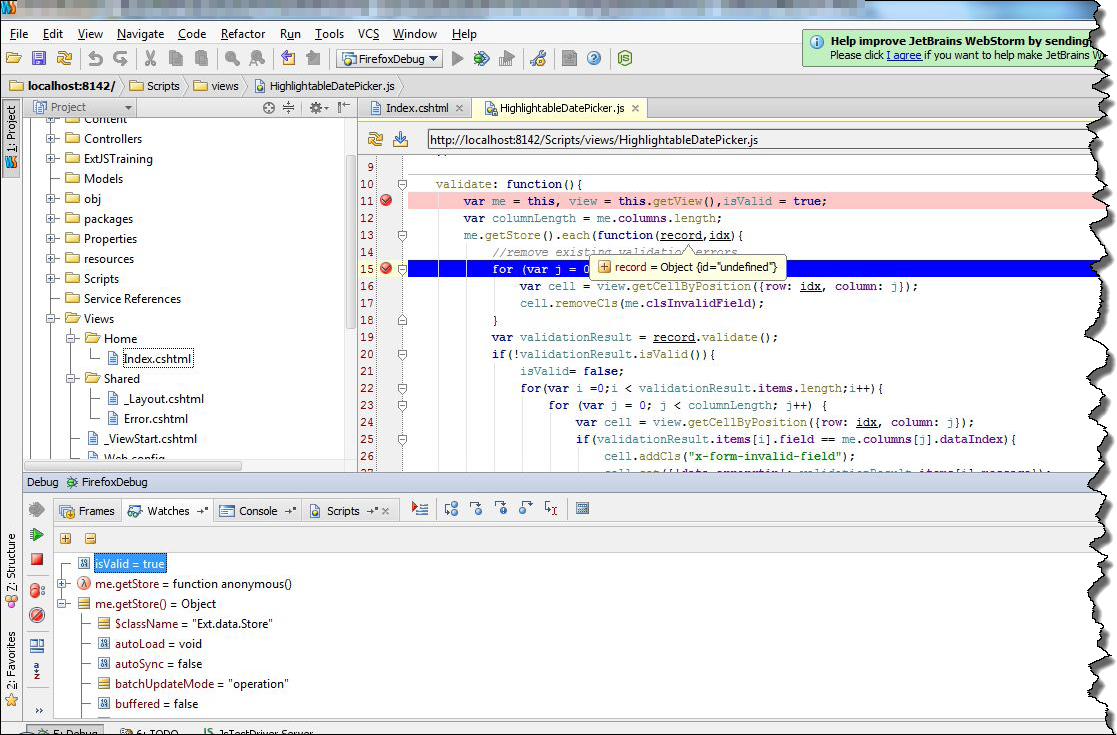
I’ve been working with ASP .NET combined with Extjs for about half a year. All this time for debugging I’ve been using Firebug in Firefox, or Developer Tools in Chrome. Although both of these tools are great, I decided to try to use build in WebStorm debugger. According to documentation this debugger should work with Firefox as well as with Chrome. However I’ve only managed to run it correctly with Firefox. In order to start debugging session, we have to make some preparation. Let’s choose option Debug… from Run menu
rundebug
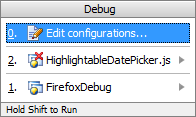
In opened small window, we have to choose first option – Edit configurations…
editconfigurationsmall
In the next window we can create new debugging profile. In order to do that, click on + sign in the left upper corner of window, then choose JavascriptDebug and Remote option.
runremotedebug
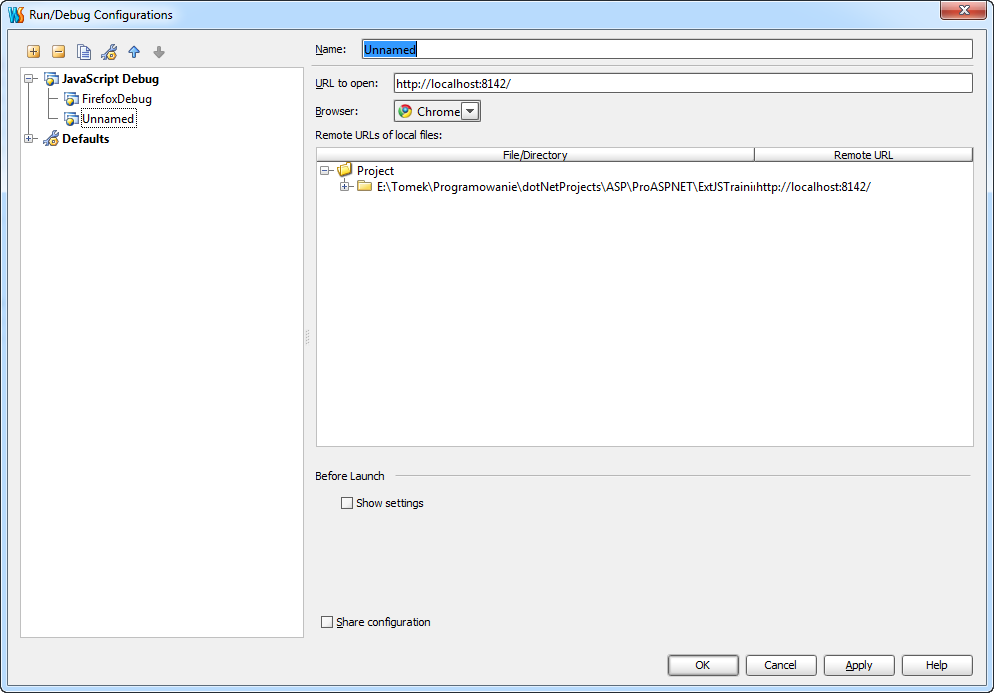
This is the final step of the configuration. The most important fields in configuration window is URL to open field, in which we specify adress of our site. In my case it is localhost on port 8142. We also have to specify mapping from remote host direcotry structure to our directory structure. Sample configuration is presented below
sampleconfig
We also have a possibility to choose browser in which our site will be displayed. I decided to choose Firefox because of the fact, that WebStorm debugger had some problems with Chrome. Now we can try to run debugging session by pressing ALT+F9. If we choose Firefox, in the very first time we run debugger, we will see this window
installExtension
which informs us that WebStorm must install extension to Firefox. Clicking OK button starts Firefox
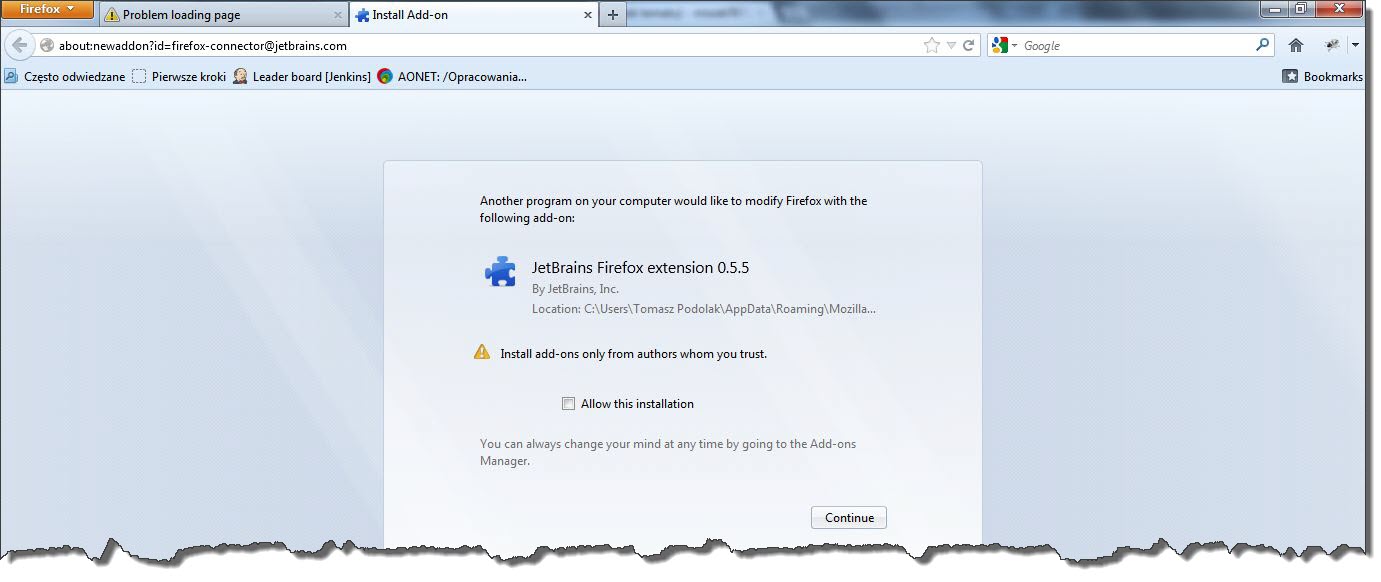
AddOnInstalation
which warns us that external program is trying to install extension. Clicking continue button will finish configuration process, and WebStorm will successfully attach debugger.
debugging

ASP.NET MVC javascript debugging using WebStorm